Producing parts from extruded stock shapes is preferred when injection molding is not practical, and many times for part performance reasons. Experienced plastics engineers have learned that the performance of a machined part can far exceeds that of an injection molded part, yet a comparison of resin and shape datasheets causes one to conclude the exact opposite.
Why do the properties of extruded shapes rarely match the properties listed on a resin datasheet?
Understanding orientation related to material flow especially when using fiber-reinforced grades is the key to understanding this observation. Molecular orientation due to melt flow profiles also impacts unfilled grades, so the same principles apply, although anisotropy is less of an issue in unreinforced grades.
All resin datasheets and material C of A (Certificate of Analysis) properties are generated using injection molded tensile bars. Datasheet or certification properties reported by the resin pellet producer are accepted by the industry to certify a lot’s conformance to a standard. These values are rarely, if ever, an accurate representation of a finished part’s strength, elongation, or coefficient of thermal expansion in all directions.
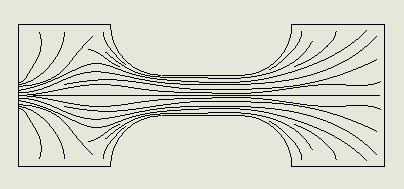
Figure 1: Molded Tensile Bar – illustrating an injection molded tensile bar’s fill profile, thus fiber orientation when injecting molten material through an injection nozzle to “pack out” and create a full density part in a polished mold. Subsequently the cooler mold freezes the part in place. The polished mold leaves an excellent surface finish with no broken or cut fibers. The fibers are aligned nearly perfectly in the test direction of pull.
Since all resin properties are characterized using injection molded tensile bars as above, the common perception is that all injection molded parts and shapes have superior properties to their counterparts machined from extruded shapes. While true in the case of a tensile bar, very few injection molded parts have a “near perfect” fill profile which optimizes the materials strength in a needed orientation. Since few injection molded parts lend themselves to being dissected into tensile bars (where their true properties can be shown), the misconception that these optimal resin properties are achieved in injection molded parts persists.
The Table below shows results for injection molded 30% carbon fiber reinforced PEEK fabricated into test specimens differently. The Resin Certification values are compared with values generated using tensile bars machined from a 4mm thick (75mm x 75mm) injection molded square plate made from the identical resin batch. Tensile bars were prepared in 3 orientations: in the flow direction, 45 degrees to flow, and perpendicular to flow to illustrate any directionality of properties.
| Tensile Strength (psi) | Tensile Modulus (Mpsi) | Elongation (%) | % Strength of IM Tensile bar | |
|---|---|---|---|---|
| Injection Molded tensile bars (ISO 527) | 37700 | 3.8 | 1.5 | — |
| Tensile bars cut from Injection Molded plaque, flow direction | 23500 | 2.5 | 1.0 | 62% |
| Tensile bars cut from Injection Molded plaque, 45° to flow | 18300 | 1.6 | 0.7 | 49% |
| Tensile bars cut from Injection Molded plaque, perpendicular to flow | 16200 | 1.4 | 0.6 | 43% |
Notice that even specimens machined to the flow direction do not achieve “resin datasheet” properties. There is directionality of properties even in injection molded parts and shapes.
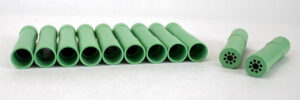
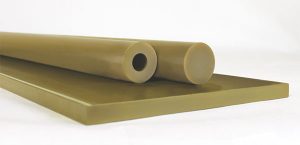
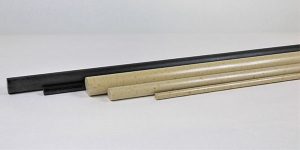
Now what does this directionality look like in extruded shapes? The very slow rate of extrusion and cooling from the outside inward leads to a “melt cone” that is the boundary between molten and solid polymer phases. Much of the reinforcement phase aligns along this melt cone meaning the directionality changes with the shape of the melt cone. The following diagrams illustrate this condition for a variety of shapes. The light grey lines depict the general shape of the melt cone. Note the shape of this cone is 3 dimensional meaning the shape is conical in the case of rod or parabolic in the shape of plate. Drake’s Seamless Tube has a melt cone that is difficult to illustrate in a 2-dimensional drawing but easy to describe. The dominant fiber direction is in the “hoop” direction meaning the fibers and therefore “melt cone” look more like a “barber pole”.
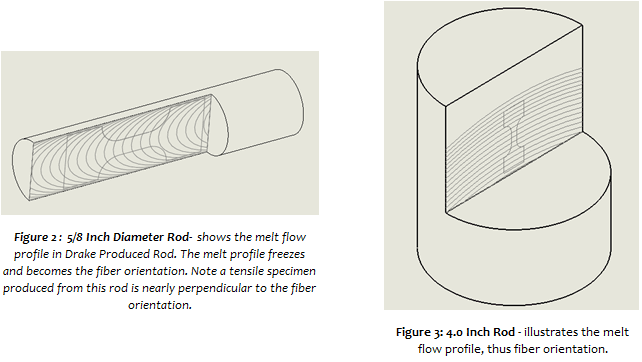
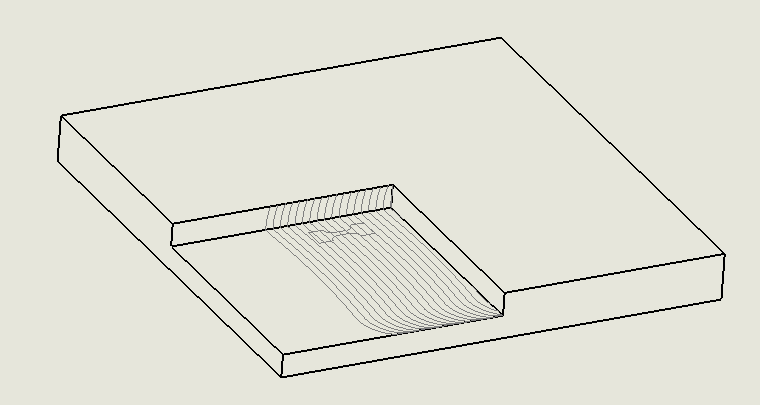
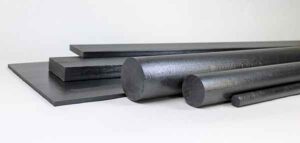
Figure 2: 12 x 12 x 1¼ Inch Flat Plate – showing the melt flow profile, thus fiber orientation of Drake extruded plate.
Maximizing the performance of polymer parts requires consideration of the shape you are starting with, the orientation of parts within the shapes and the specific location of gates and vents if you are planning to injection mold parts or shapes. Drake’s engineers understand this and always consider it when developing a process sequence to make a performance critical part. Ask Drake.